Documentation
Your first ten minutes
Five commands and one button. Everything after this chapter is detail.
Graphlit keeps a Software Graph — a typed, verifiable map of your screens, routes, services and tables — and keeps it in step with your actual code. The graph command is the terminal half of that. It signs you in, attaches a folder to a project, checks the graph against what is on disk, and connects your machine so that pressing Execute in the browser builds the work here.
1 · Sign in and attach a folder
graph setup is sign-in and attach in one step. The installer runs it for you; run it again any time, from any folder.
cd ~/code/my-app
graph setup
It opens your browser to approve the terminal, then shows the projects your account can open and asks which one this folder is. If you are already signed in, graph link on its own does the second half.
The binding is written to .vipl/link.json in the folder. It holds no secrets — commit it, and everyone on the team gets the same binding.
2 · Check where you are
3 · Draw the architecture in the browser
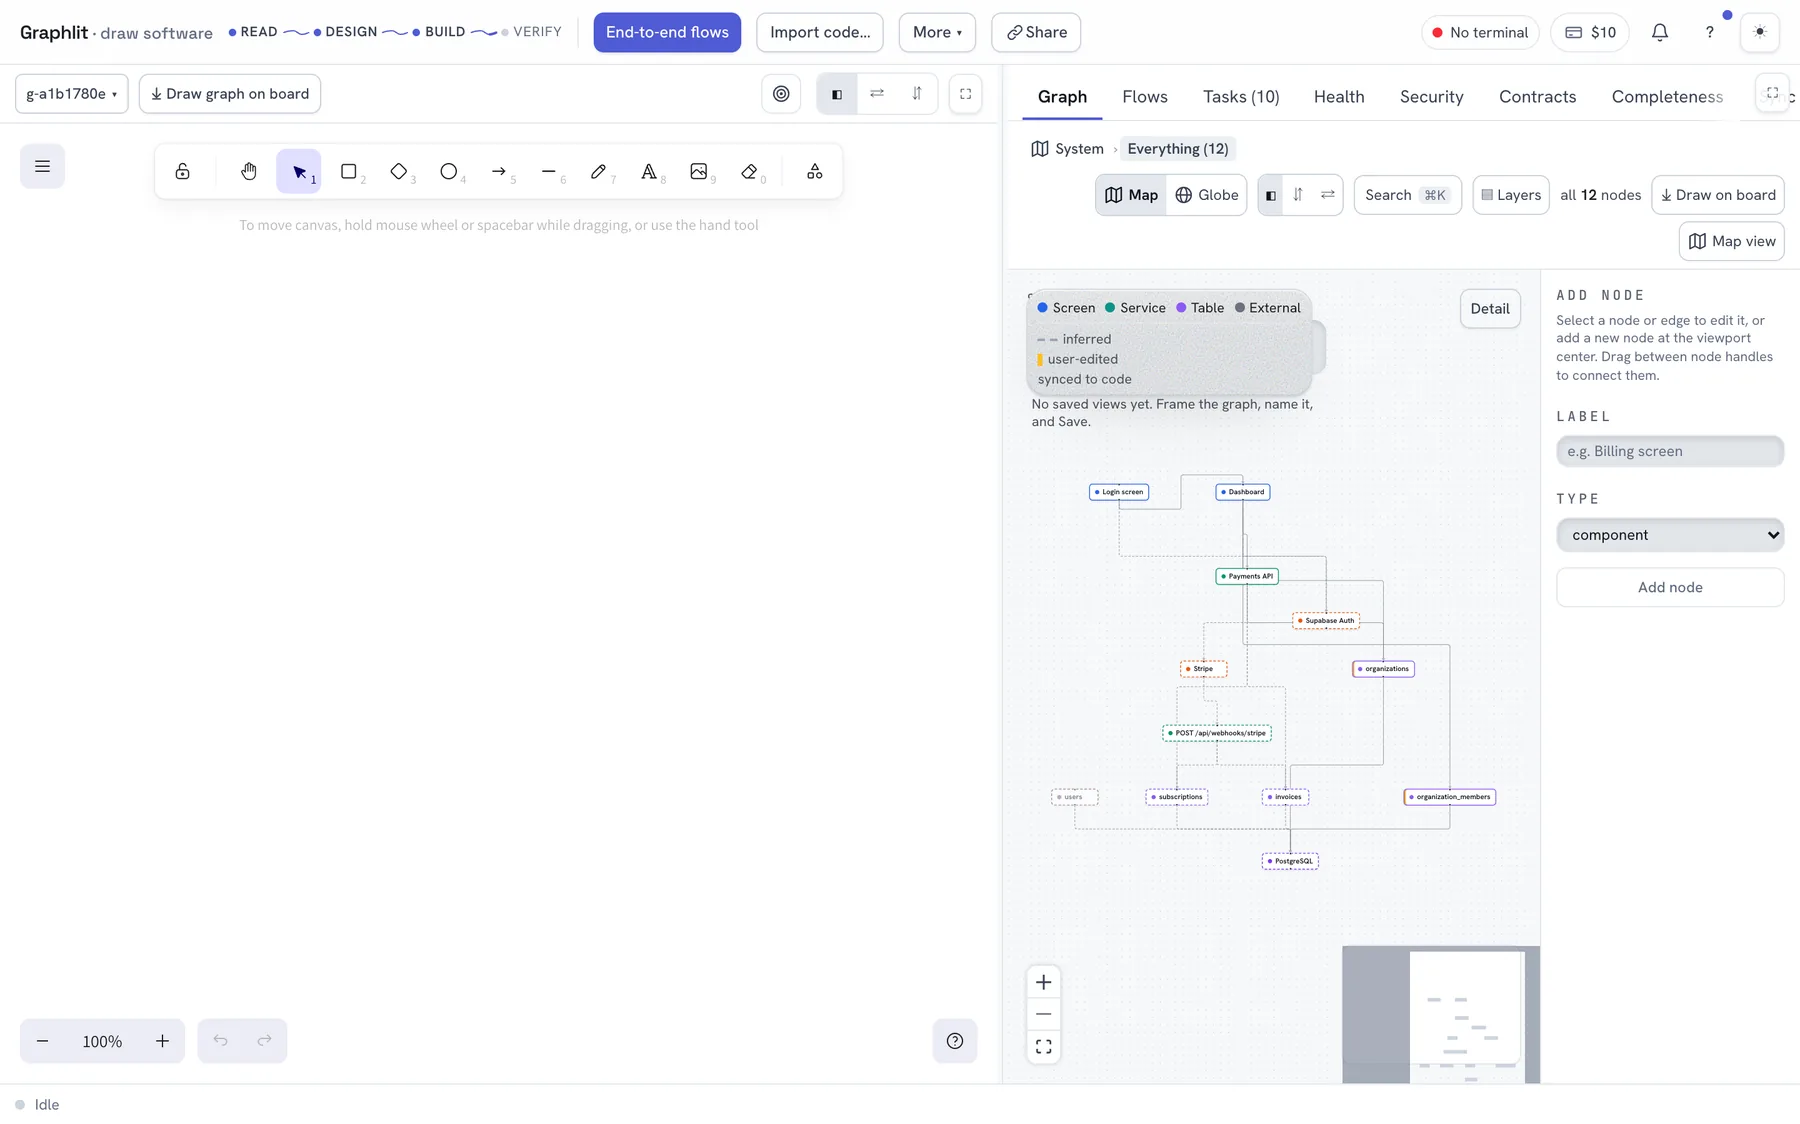
Open the board and sketch the system — boxes and arrows, by hand or with the shape tools. Press Interpret sketch and it becomes a typed graph: screens, APIs, services, tables, with the edges between them.
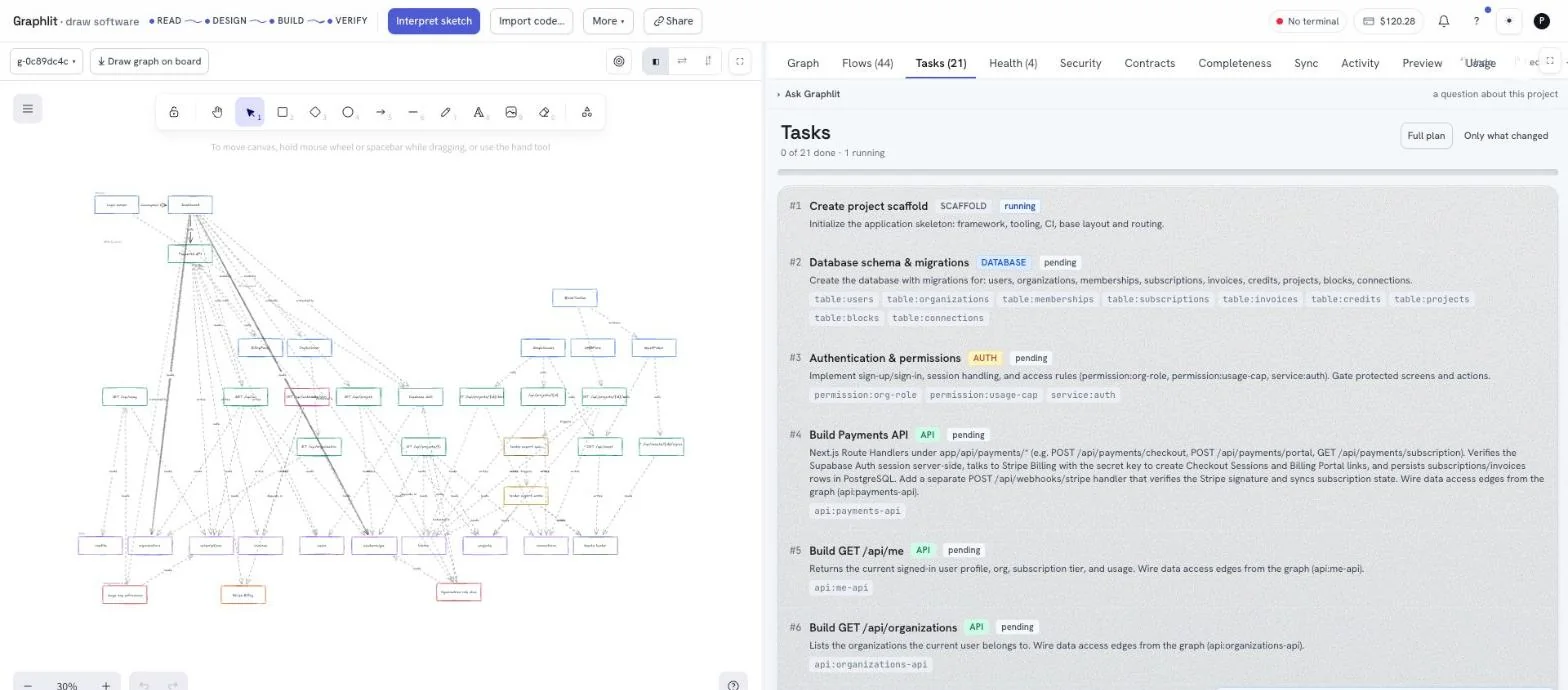
Then press Generate tasks. The graph becomes an ordered build plan: one atomic task per piece of the system, each one knowing which tasks must finish first.
4 · Connect this terminal
In the linked folder, run the runner and leave it up:
graph agentThe board's terminal indicator turns green. Every task you Execute from now on is built in this folder, by your own coding agent, under your own login.
5 · Press Execute
Back on the board, press Execute on the first task. Nothing reaches inward to your machine — your terminal is polling outward, sees the work, claims it, and starts building. You watch it happen in both places at once.
When it finishes, the work is committed to your project's git history and the board turns the row green. Then do the next one.
That is the loop
- Draw or import the architecture — The board, maintaining a project.
- Plan it into tasks — Managing the plan.
- Build each task on your machine — How a build actually runs.
- Verify the code still matches the drawing — Keeping the graph true.