Documentation
The board in the browser
The terminal is where code gets built. The browser is where the architecture gets decided — and where you watch the building happen.
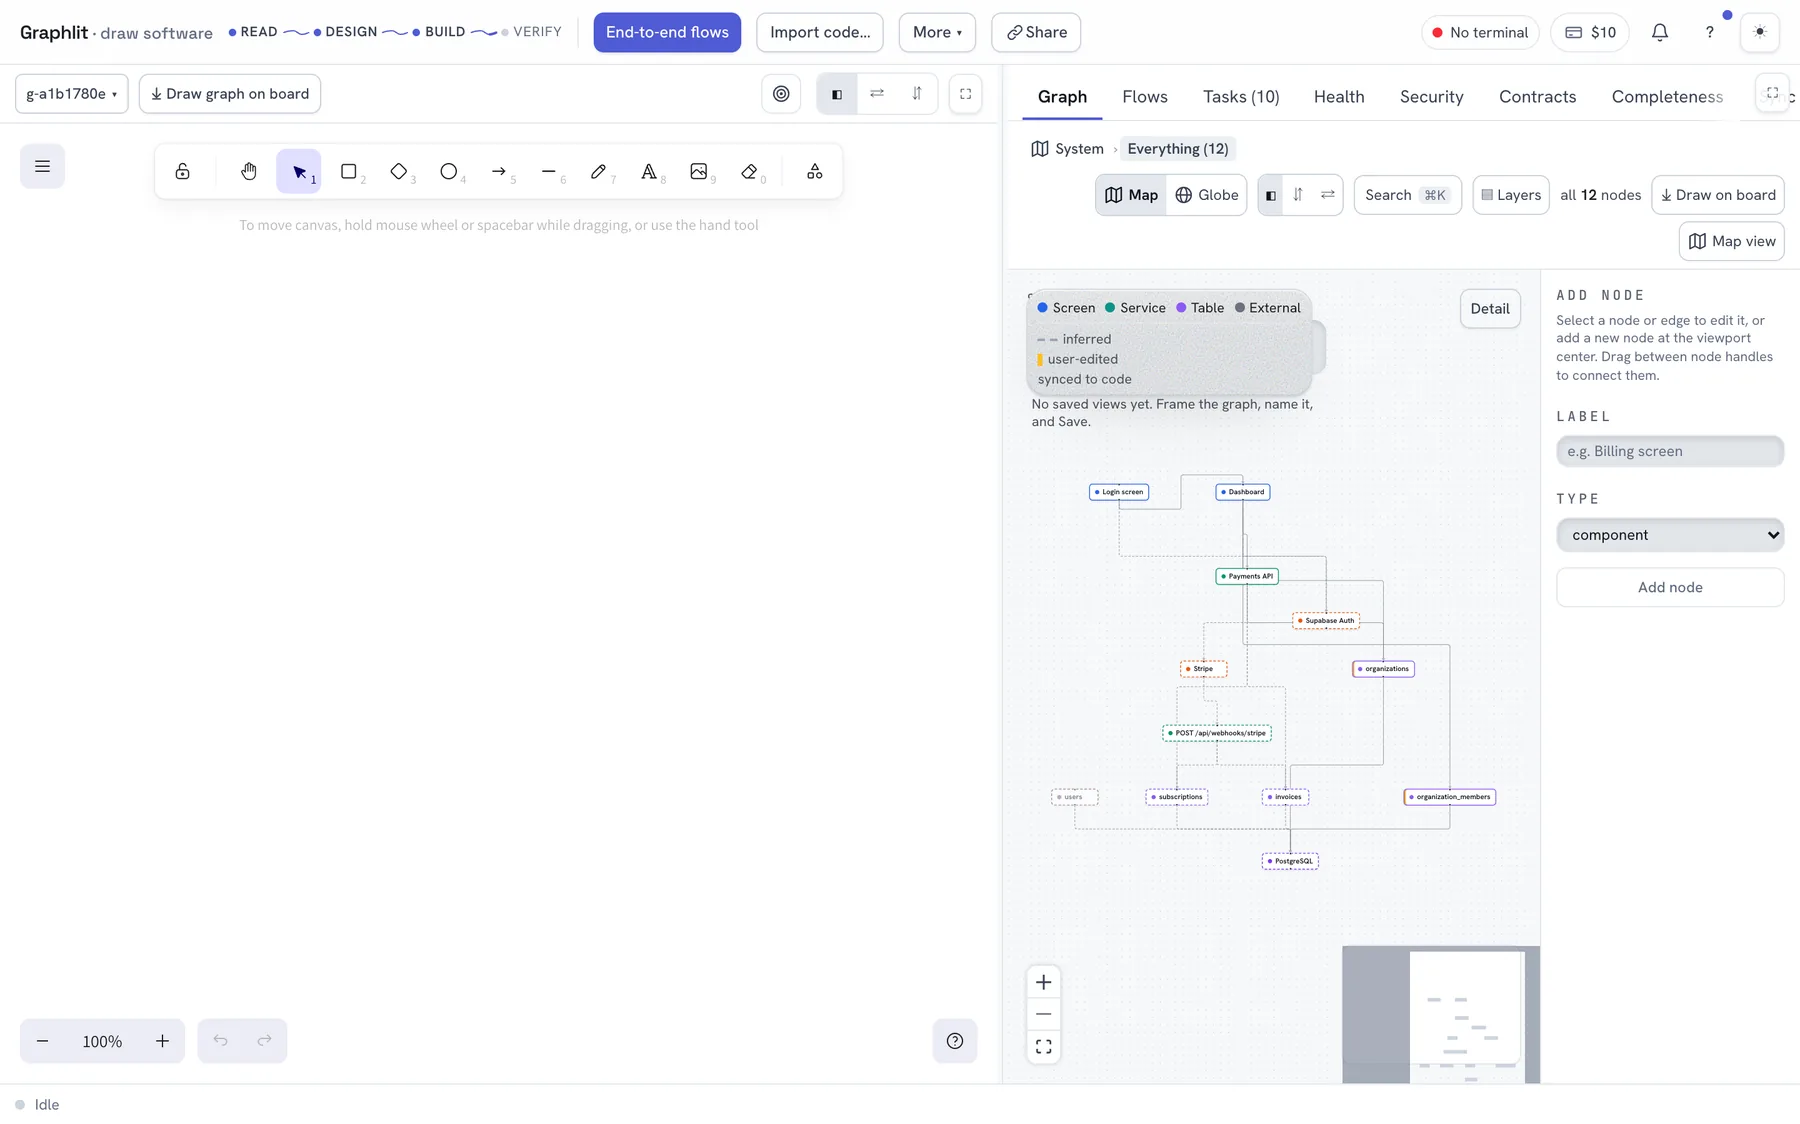
Open it at graphlit.co/app. It is one screen, split: a canvas on the left, and on the right a stack of panels that all read the same project.
The whiteboard, and the graph
The left half is a real whiteboard. Draw boxes and arrows freehand, or with shapes, or paste a photo of a whiteboard from a meeting. Press Interpret sketch and it becomes a typed graph.
Re-interpreting merges. Your edits survive; anything that has disappeared from the drawing is flagged rather than silently deleted. Every node carries where it came from — sketch, inferred, user or code — and the graph shows you which is which, so the model made this up is always a visible fact rather than a suspicion.
The panels
| Panel | Answers |
|---|---|
| Graph | What is the system? Typed nodes, typed edges, auto-laid-out. Select anything to see the files behind it |
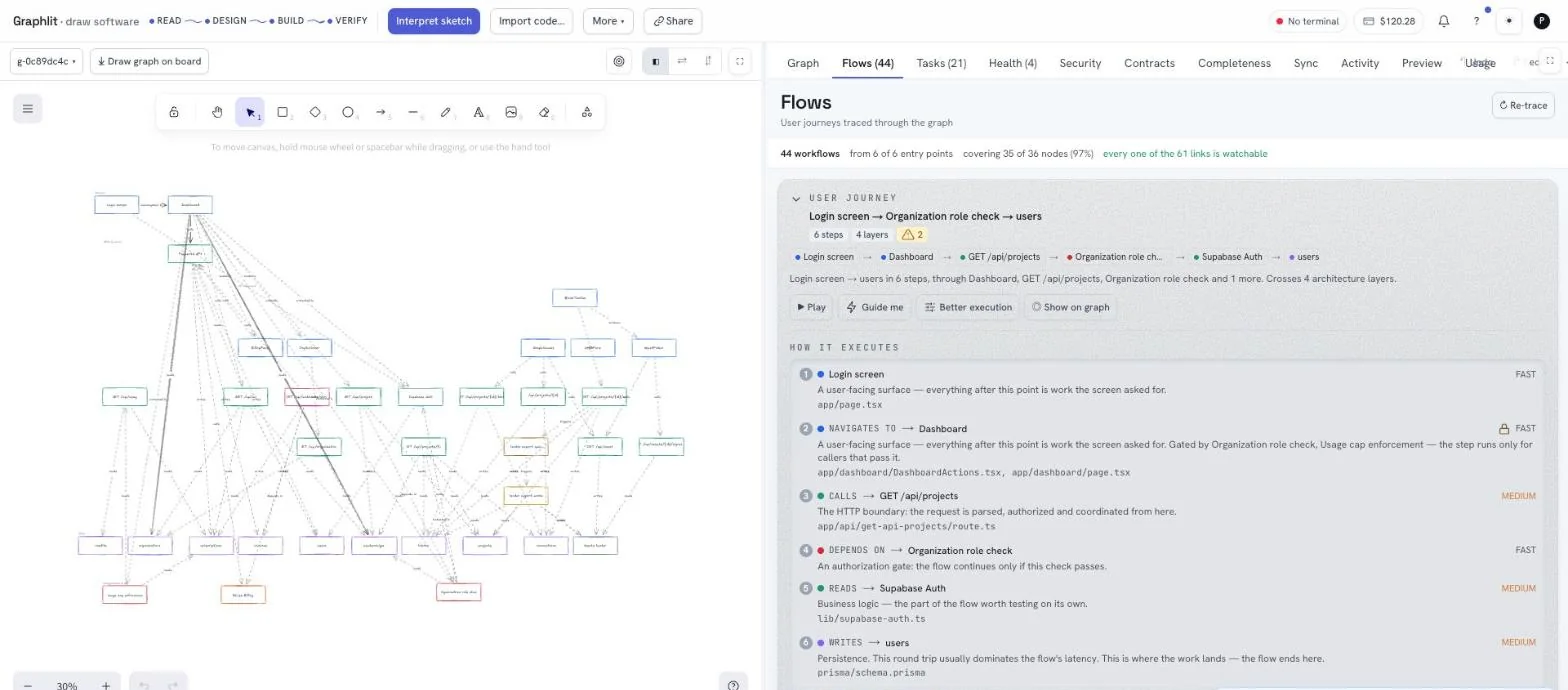
| Flows | What happens when a user does X? A path through the graph, replayed against the code as it is |
| Tasks | What is left to build, in what order, and what is running now |
| Health | What looks wrong — nine deterministic defect kinds, with the file and line |
| Security | Where the risk is, located by the shape of the architecture and then confirmed against the real files |
| Contracts | Which architecture rules you have asserted, and whether they currently hold |
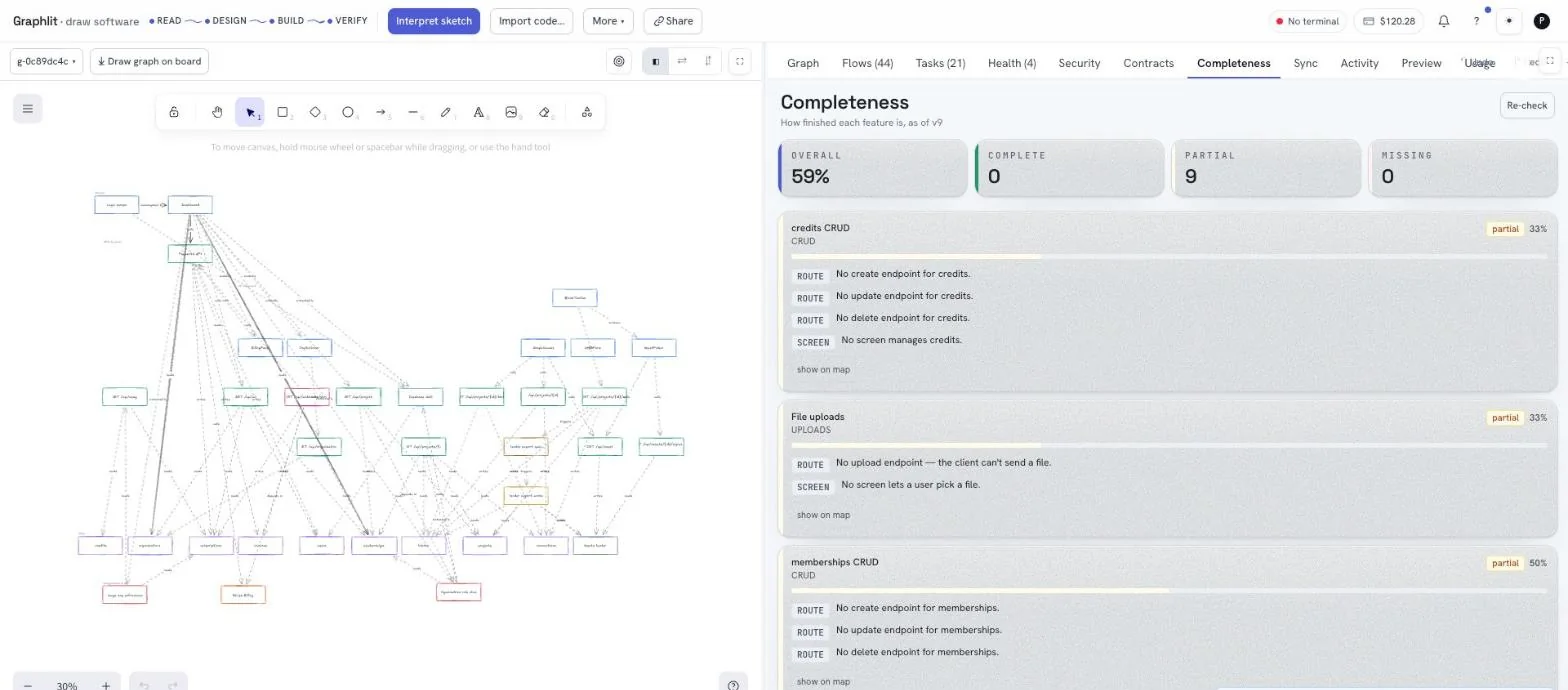
| Completeness | What the graph says exists but the code does not, and the reverse |
| Sync | Which nodes have drifted from their code, and what to do about each one |
| Activity | Who did what, and a live narration of whatever is running right now |
| Preview | The running application |
| Plan | The build plan and its progress |
| People | Who is in this project and what they may do |
| Usage | What has been spent, and on what |
| Account | Your model provider, keys, billing and organisation |
Health, Security and Sync each start empty and are run on demand — they are scans, not live readings, so a project you have never scanned shows a button rather than a stale answer.
The terminal indicator
Top right, next to your balance: Terminal in green when a graph agent is connected to this project, and No terminal when there is not one. It is the single most useful thing on the screen when Execute is not doing what you expect.
It reports terminals on any machine, not just this one — so a teammate's runner shows here too, and graph status --all in your own shell is the mirror image of the same fact.
Which surface for which job
| Job | Better in |
|---|---|
| Deciding the architecture | Browser — drawing is a browser thing |
| Reading a defect with the code beside it | Browser |
| Watching a build | Either — they show the same events |
| Running a build | Terminal — it happens in your checkout either way |
| A gate in CI | Terminal — graph check, one exit code |
| Answering why is nothing happening? | Terminal — graph status needs no page load |
| Sharing a finding with somebody | Browser — every panel has a URL |
Neither is a subset of the other, and neither is authoritative: they read and write the same graph, the same plan and the same statuses.